

This post is the first part of a small series of articles about using the SDRVM to automate monitoring and signal detection tasks.
Instant DVB-T2 monitoring
Monitoring TV broadcast is always a good basic exercise for SDR development. In this example we will use the SDR4Space free version so you can replicate it, and we will use a RTL-SDR USB dongle.
The first approach one would start with is a spectrum analysis of the band, from 470 MHz to 700 MHz for example, as shown below
Usual channel spacing is 8MHz for french DVB-T.
A first look on the plot shows channels 22, 25, 36, 40, 43 are good candidates !
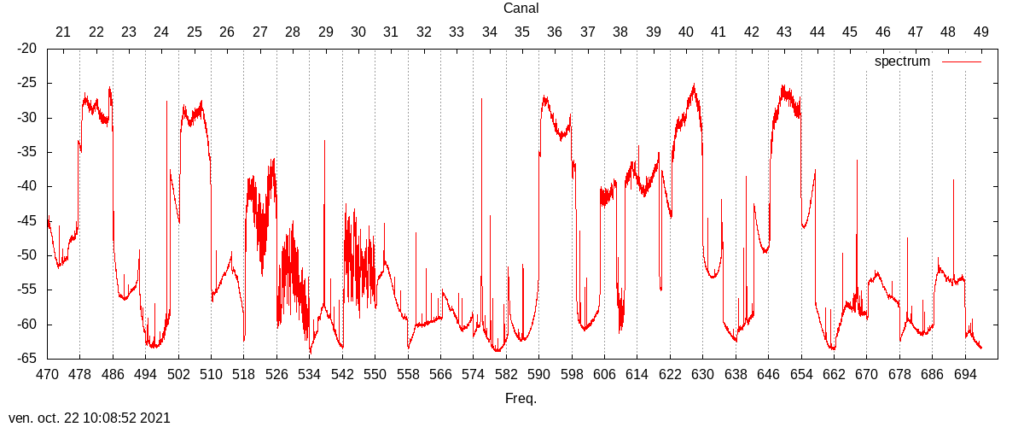
While this is an useful estimation of the RF activities, we still have many unknowns:
- How stable it is during long run : is the signal level constant over time ?
- Which channels are really active ? (for example 38 and 39 seems suspicious).
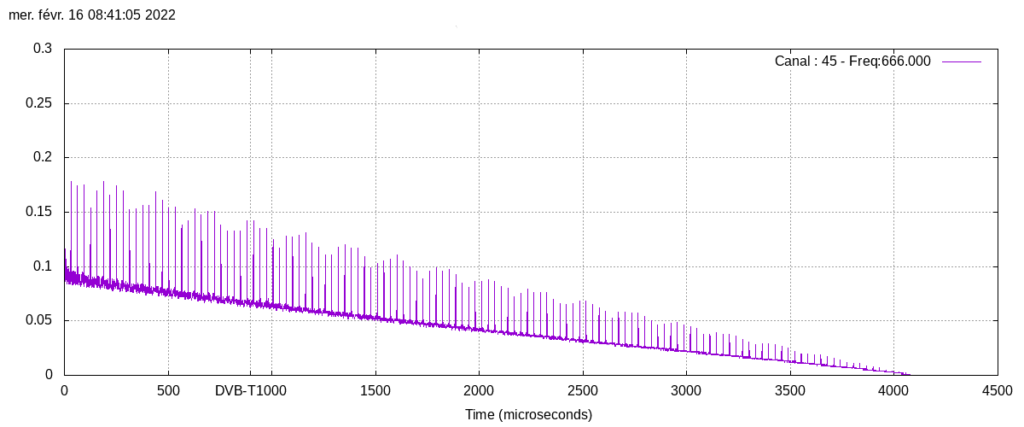
In a first approach one can use auto-correlation of the channel stream and check if interesting features can be detected. In the DVB-T2 example we can first try to detect the symbol timing, here (in France) we are seeking for a 896us spacing, it’s an 8MHz 8k FFT mode.
This method will allow us to use a 2MHz bandwidth dongle.
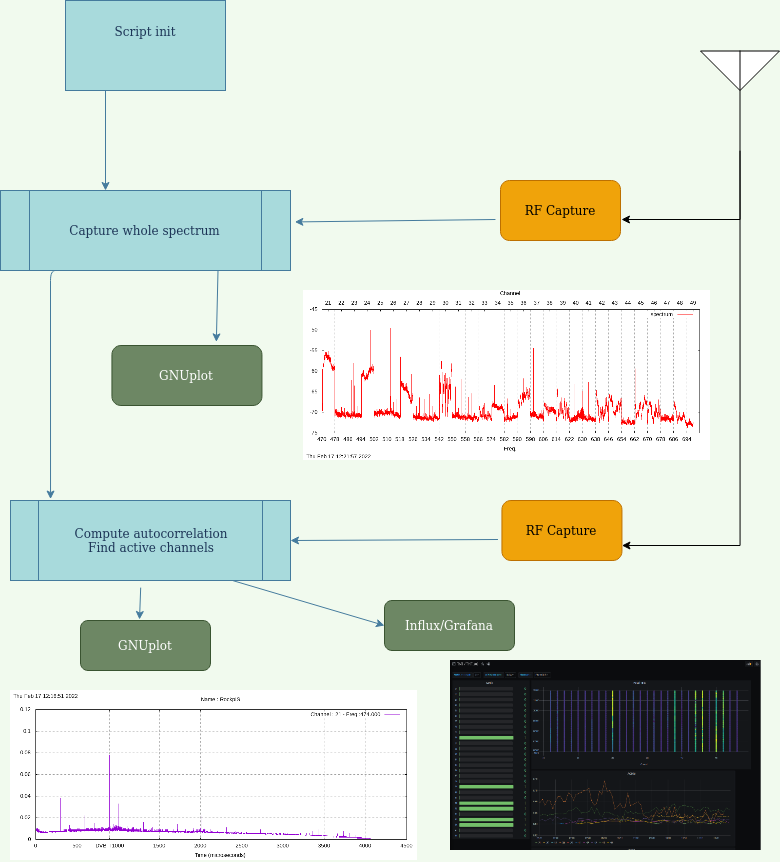
The example script opens an RTLSDR Receiver and makes half second captures (1e6 Samples) centered on each channels, then estimates the auto correlation on the samples and push results through Influx DB Server and gnuplot.
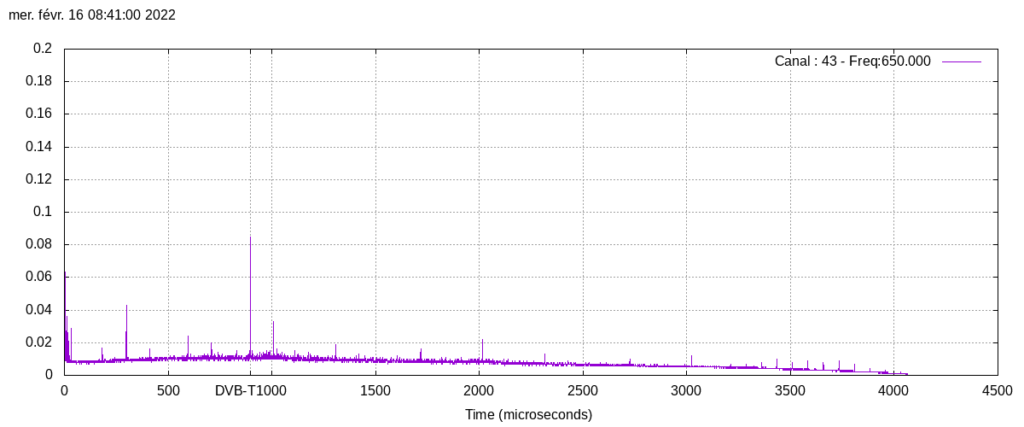
The channel 43 is certainly a DVB-T2 channel, we can easily spot the 896us symbol timing.
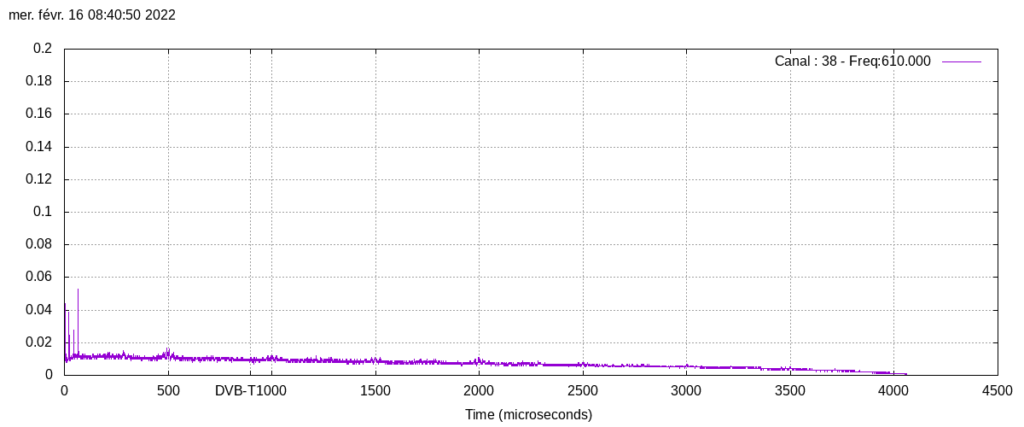
As opposed the channel 38 seems to be used for something else which doesn’t match the DVB-T2 symbol timing. You may find interesting channel like 45 with specific auto-correlation, in France they can be used for temporary events communication.
Coupling the ease of SDRVM scripting with database server allow you to quickly setup a long run monitoring system.
Recording and analysing data
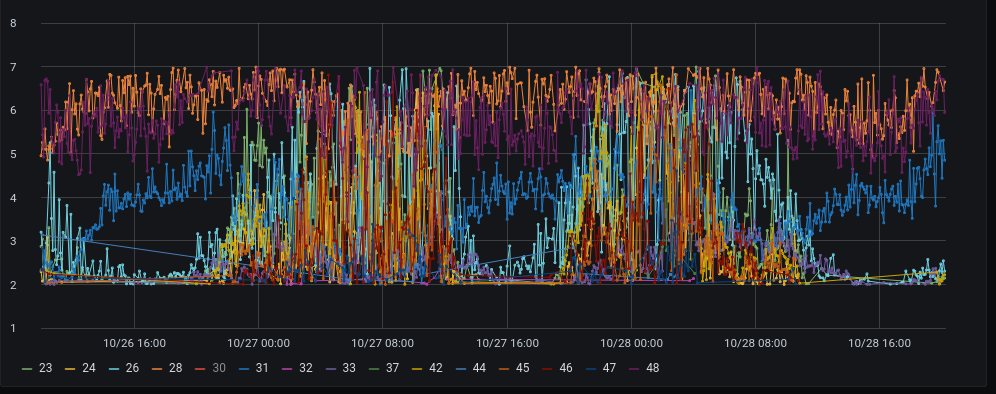
In few lines of code you can push all the data to an Influx server and display them in Grafana or any other visualization tool. In this example it allowed us to observe a difference in received signal following the day.
The following picture is a view of the DVB-T2 detection for 3 days, you can notice some channels activation during the night and the morning. (We didn’t investigate why it happens)
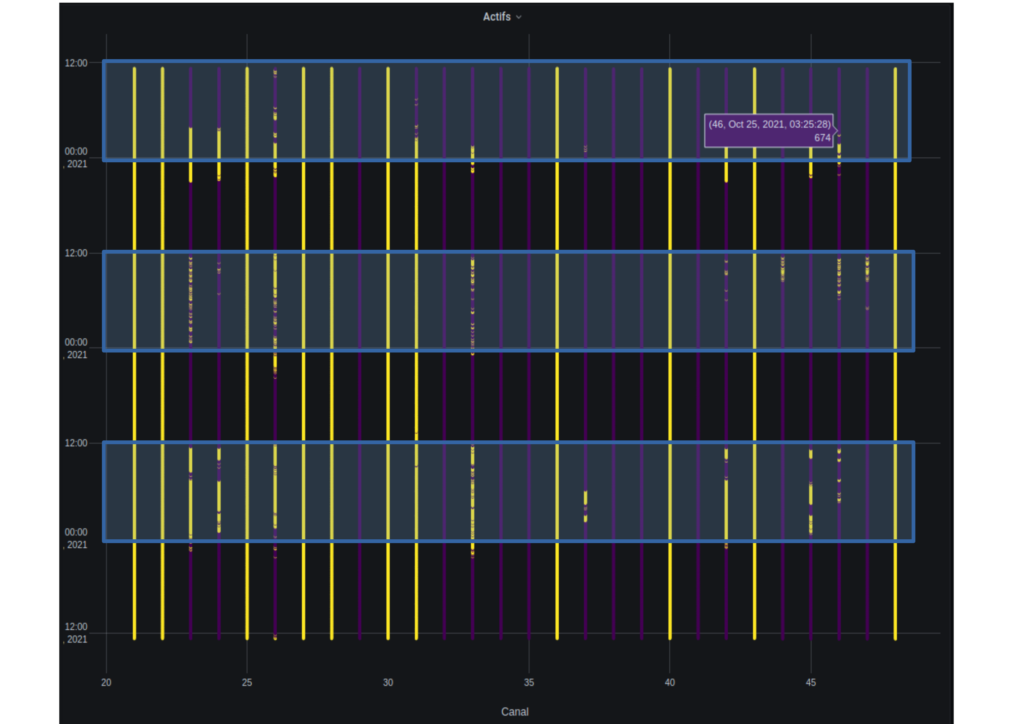
This view is binary but since the script uploads all the data you can display differently and notice that the transition is smooth.
Monitoring Script
All the script for this example are available on the SDR4space github here: https://github.com/SDR4space/Examples/tree/main/RX/DVBT_monitor
Comments are closed